


Angus Reid Institute has released a new survey report: “Religious Trends: Led by Quebec, number of Canadians holding favourable views of various religions increases”. Well… the title pretty much sums it up, doesn’t it?
This is apparently a thing ARI does every few years, having done it , and back in 2009 – before ARI, back in the days of Angus Reid Global.
ARI’s focus across the series seems to be mostly on the divide between Québec and the rest of Canada (ROC). I’m not really on board with the Québec-baiting that seems to be so fashionable of late, but unfortunately, while the newest report includes overall numbers, the previous report only reports ROC-versus-Québec numbers… so I really can’t get around singling out Québec a bit. I also have to note that the latest survey was done between and … smack dab in the aftermath of that incident. So, yeah.
There were three questions in the survey:
- one was about favourable/unfavourable opinions on six different religions;
- one was about supporting/opposing the wearing of eight different symbols; and
- one was rather bizarrely about whether it would be acceptable/unacceptable for your children to marry a member of one of six different religions.
Let’s start with the opinions on religions.
Favouring religions
There’s a couple things I want to note before getting into the details here.
First, there was no “neutral” option. The only options were “very favourable” (VF), “moderately favourable” (MF), “moderately unfavourable” (MU), “very unfavourable” (VU), and “not sure” (NS). The “apathetic”/“don’t feel strongly either way” contingent is usually quite large on these kinds of surveys. In this case, they would have probably either been forced into one of “moderately favourable”, “moderately unfavourable”, or “not sure”. Consistent with the general “don’t care” attitude of Canadians toward religion, I note that the “not sure” numbers are rather large – for example, for the case of Sikhism, the VF/MF/MU/VU averages were 10%/29%/15%/13% – so 38% have a favourable view, 28% have an unfavourable view – but 34% were “not sure”. The “not sure” group was not less than 20% for any religion, except Christianity (where it was still 11%).
Finally, this question is subtly different from the one asked in their survey, which I covered. But I think the difference is very important. The 2015 survey asked, essentially, “how do you feel toward the following groups?” (and then listed “Muslims”, “Hindus”, etc.). This survey asks, “what is your opinion of the following religions?” (and then lists “Islam”, “Hinduism”, etc.). Catch that? One is asking how you feel about the people. The other is asking about the faiths. This is a critical difference; I, for example, would probably feel “neutral” toward all the groups (that is, the people), but probably at least “moderately unfavourable” toward all the religions.
Also, you’ll probably notice, no form of nonreligion was asked about.
So here’s what it looks like overall, also showing the results from the previous two surveys:
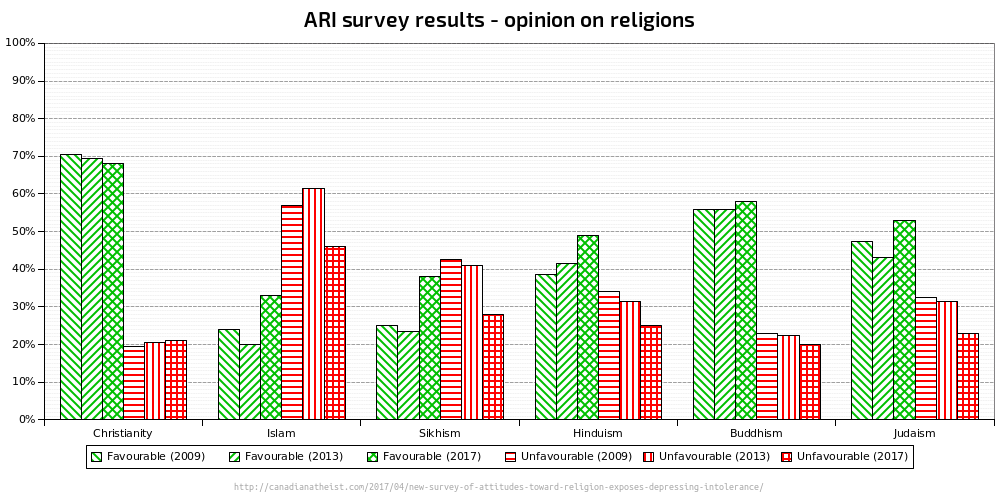
Excepting Christianity and Islam, there appears to be a slight rising trend in favourable opinions – and dropping of unfavourable opinions – for all religious groups. Christianity appears to be going the opposite way, but only very slightly, and well within the 2–3% margin of error. (Buddhism also appears to be stagnant.)
The big story is Islam. It’s the only religion that is viewed more unfavourably than favourably, and its been a pretty turbulent ride for Islam. The ARI report notes that the wild swings are pretty much entirely due to Québec, and I can’t dispute that – at least not with the limited dataset I have. Québec’s favourable numbers have doubled between 2013 and 2017. Of course, that may just be a knee-jerk uptick given that the 2017 survey was done right after the Québec City mosque shooting.
Here’s a closer look at the 2017 data:
| F | U | NS | VF | MF | MU | VU | |
|---|---|---|---|---|---|---|---|
| Christianity | 68% | 21% | 11% | 37% | 31% | 12% | 9% |
| Islam | 33% | 46% | 21% | 9% | 25% | 21% | 25% |
| Sikhism | 38% | 28% | 33% | 10% | 29% | 15% | 13% |
| Hinduism | 49% | 25% | 27% | 13% | 35% | 14% | 11% |
| Buddhism | 58% | 20% | 22% | 22% | 37% | 10% | 9% |
| Judaism | 53% | 23% | 25% | 17% | 36% | 13% | 10% |
As you can see, for most religions, “moderately favourable” is the most popular option – and I suspect only that because there was no “neutral” option. The only exceptions are Christianity and Islam. Christianity has a high “very favourable” score, which mostly comes from (in rough order of largest to smallest influence) older Canadians (65+) – notably women 55 and older, Conservative Party voters, and Saskatchewan. Islam’s “moderately favourable” score is also high, but it’s tied with its “very unfavourable” score. That unfavourable balance seems to come mostly from Conservative Party voters, Alberta, and males 35 and older… but, surprisingly to me, the most antipathetic toward Islam are: Green Party voters. Huh, who’d’a thunk it?
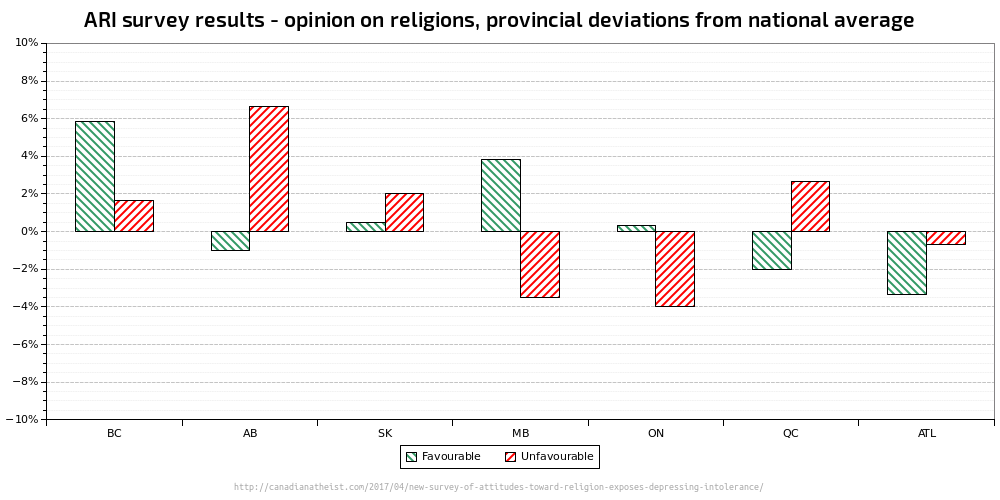
BC and Alberta have the strongest opinions about religion, with BC more generally favourable and Alberta more generally unfavourable; British Columbians really like Sikhism and Buddhism, while Albertans really dislike Islam and Sikhism. Since Québec is the focus of the ARI report, I’ll mention where it stands: Québec is actually pretty much inline with the overall average opinions about most religions – yes, even including Islam… except for a surprising uptick in antipathy towards Judaism.
When it comes to age, younger people have more favourable – and less unfavourable – opinions, generally. In fact, the youngest age group – 18–24 – has much higher levels of favourable and much lower levels of unfavourable than the average for all religions… except Christianity. For them, Christianity is the only religion they find less favourable, and more unfavourable, than the average, though only slightly. It seems the people with the lowest opinions of religion are in the 35–54 range. Though, surprisingly, it’s not really Islam they dislike – it’s Christianity and Judaism, followed by Hinduism and Sikhism. It’s not until you get to the 65+ cohort that you start seeing crazy-mad love for Christianity and Judaism, and real dislike for Islam.
One result that surprised me was that higher education correlated to significantly more favourable views of religion, and less unfavourable. That was true for all religions, but especially for Hinduism and Buddhism.
Religious accessories
Now we come to what is perhaps the single stupidest controversy in Canada: the wearing of religious accessories.
And if you’re one of those people who only wants to dictate what people wear if they work for the government – and not for the general public – well, that’s still stupid, but that’s not what this survey asked about. The question was merely: Do you support or oppose people wearing each of the following religious symbols or clothing in public?
To be fair, the survey doesn’t specifically ask whether one supports or opposes people’s right to wear these accessories in public. So it is possible that people interpreted it as “even though people should certainly have the right to wear the item, do you personally agree with it as a fashion choice?” But practically, that seems unlikely – more likely people would interpret being asked if they support/oppose wearing an item, as actually supporting/opposing other people wearing them.
For the sake clarity, the survey provided those who want to dictate what others wear with a handy chart, so they could more accurately control other people’s clothing choices. It was similar to this:

Respondents were allowed to choose whether they “strongly support” (SS), “support” (S), “oppose” (O), or “strongly oppose” (SO) people wearing each item in public. Note, no “don’t care” or “not sure” option at all.
The results are mostly positive, as shown on the chart below (“total support” is the combination of both “strongly support” and “support”, and the same goes for opposition):

For most religious accessories, at least two-thirds – up to 90% for crucifixes – support people wearing them. The exceptions are the burqa, niqab, and kirpan. Which is understandable – they are the only three items on the list that have practical consequences to other people, not just the person wearing them. (Wearing a burqa/niqab can make identification difficult, and the kirpan is a knife, ceremonial though it may be.)
Digging a little deeper, though, it turns out Canadians don’t really care all that much. In fact, none of the supported items are all that strongly supported. And of the opposed items, the kirpan is slightly less strongly opposed than merely opposed. Both the burqa and niqab are rather strongly opposed, though.
| Total support | Total oppose | Strongly support | Support | Oppose | Strongly oppose | |
|---|---|---|---|---|---|---|
| Crucifix | 90% | 10% | 28% | 62% | 7% | 3% |
| Nun’s Habit | 88% | 12% | 24% | 64% | 9% | 3% |
| Star of David | 87% | 13% | 23% | 64% | 8% | 5% |
| Kippa | 85% | 15% | 19% | 66% | 9% | 5% |
| Turban | 77% | 23% | 17% | 60% | 15% | 8% |
| Hijab | 75% | 25% | 16% | 60% | 14% | 10% |
| Kirpan | 33% | 67% | 7% | 26% | 36% | 31% |
| Niqab | 32% | 68% | 8% | 24% | 27% | 41% |
| Burka | 29% | 71% | 7% | 22% | 27% | 44% |
Digging deeper, it’s surprising how little strong support there is for wearing any religious accessories, even crucifixes. The most support for wearing crucifixes comes, surprisingly, from Bloc Québécois voters. In fact, their support for crucifixes is the strongest among all groups for all symbols. Despite this BQ voters still have overall the weakest support for the crucifix, after only Québécois in general. (Interestingly, Green Party voters have one of the weakest levels of support for the crucifix, and generally among the weakest support for all symbols.)
Of those accessories that are generally opposed, most of the opposition seems to come from – in order from the strongest opposition – Green Party voters, older Canadians, Québécois, Conservative Party voters, males 35 and older, and uneducated people.
Who your children marry
The last question on the survey has to be the most offensive. It asks: Would it be acceptable or unacceptable to you if one of your children were to marry a person who was a follower of any of these religions?
(Then it lists the same six religions from the first part.) Yeah, seriously. It asks that question. In 2017.
Even more disturbing was the way people answered it. Brace yourself:
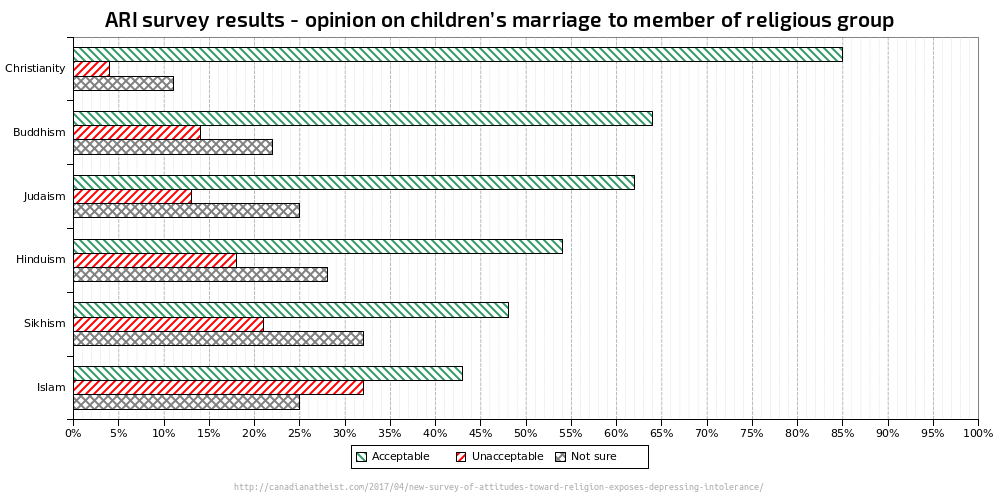
Yeah, that’s pretty depressing. Except for Christianity (natch), less than two-thirds of Canadians would accept one of their children marrying a member for any of the religions asked about. In the case of Sikhism and Islam, it’s less than half. And almost a third of Canadians think it would be straight-up unacceptable for their child to marry a Muslim. Oh, but I’m sure that’s just totally reasonable criticism of Islam </sarcasm%gt;.
So where exactly are the assholes, demographically? Well, the highest levels of “unacceptable” are generally among (starting from highest): Conservative Party voters (except for the case of Judaism, which Green Party voters really find unacceptable), Green Party voters, Albertans (except for the case of Judaism, in which case it’s Québécois), older Canadians (particularly older men), and lesser educated people.
Summary
Overall, this survey isn’t really as interesting or useful as ARI’s 2015 survey (though that may have been mostly due to the involvement of the University of Lethbridge’s Dr. Reginald Bibby). It doesn’t really give much information that is new or surprising to anyone who’s been following these trends, and what information it does give is pretty useless from the perspective of people who care about policy.
It does give some insight into attitudes. What it shows is generally depressing, but it’s hard to take it seriously, because the allowed answers don’t really allow much room for the standard “live and let live” Canadian attitude. Not allowing that option has probably skewed the results to the point where they’re practically useless. For example, 25% of Canadians oppose (14%) or strongly oppose (10%) the hijab… but what does that mean? Does it mean they just don’t like it, or that they actually want it banned from being worn in public?
The one marginally interesting insight it does give is profoundly disturbing: that large chunks of Canada think that who their adult children marry is any of their fucking business.
The marriage question (and oddballs like it in our surveys) is about trying to pull out underlying attitudes. I can easily imagine (some) people not wanting to say they dislike Muslims (knowing they’re supposed to be tolerant and whatnot) but being a bit more willing to disclose that they’d rather their kids not marry one. It’s sort of like the “would you vote for a…” question.
I get the reasoning behind this type of question… but this *particular* question still strikes me as a bit much.
I mean, “would you vote for…” is one thing – an anti-Hindu bigot (for example) can at least justify refusing to vote for a Hindu on the grounds that their Hindu beliefs might influence their decisions in office. The “Hinduness” of a PM can very conceivably have an impact on “me” (“me” being the person answering the question), so it’s not exactly *outrageous* for a person to object to a Hindu PM.
But “would you accept your child marrying…”? Seriously? There’s no rational extrapolation that has “my” kid’s spouse’s “Hinduness” having *any* impact on “me”. And there’s a history of intolerance of “miscegenation” that is tightly bound to racism and other socially frowned-upon attitudes. I mean, “would you accept your child marrying <member of racial/cultural/whatever group>” is just one very short beat away from “do you hate <racial/cultural/whatever group>”, in a way that I would have thought most half-intelligent Canadians couldn’t miss. I’m really surprised to be *this* wrong about that.
“This is a critical difference; I, for example, would probably feel ‘neutral’ toward all the groups (that is, the people), but probably at least ‘moderately unfavourable’ toward all the religions”
This is a distinction without a difference. As the US Supreme Court noted in relation to homosexuality, they “declined to distinguish between status and conduct”, because such a distinction is irrelevant. It can be no different with religion. If you’re against bad ideas and for good ideas, then you are necessarily against the people who identify themselves with bad ones and for the people who identify themselves with good ones.
Think of it this way. You’ll relate to this. “Punch a Nazi!”
Except when normal people oppose the ideas promoted by other people, we don’t punch them, even if they are Nazis. Because we’re normal.
“well within the 2–3% margin of error”
Well, that’s the margin for each year, however that is NOT the margin for a series of three, which would be narrower, particularly if all you’re interested in is whether the trend is up, down, or level. Math. It works.
“For them, Christianity is the only religion they find less favourable, and more unfavourable, than the average, though only slightly”
This is the REAL story of the survey. And, while I agree with them on this point, it means something different for these kids than it does for me.
I oppose all religions, including Christianity, the one that has affected me most personally and negatively.
But for these kids, having been taught by incompetent teachers for the last few decades, it’s all about hating the people who built Canada. And those people were largely straight, white, Christian, and male. So it’s no surprise at all to see them picking on Christianity, while giving a pass to all the others, despite Christianity’s relative harmlessness today, in comparison to, say, Islam. Find me a priest in Canada preaching that the Jews and gays should be killed. Take all the time you need.
“And if you’re one of those people who only wants to dictate what people wear if they work for the government – and not for the general public – well, that’s still stupid”
Well I realize that fair and equal treatment by a secular government might SEEM stupid to you, but it’s the only way that a diverse people can coexist.
You cannot, in good conscience, ask a person to accept service from another who not only hates them, but has taken that hate so far as to demand special exemptions to the dress code, to proudly display that hate to whole world, endorsed by the government. It boggles the mind that we ever caved in to this. It’s such a shame. It will take a generation to roll back, but we will do it before I’m dead. You’ll live to see it too. That’s the beauty part.
“The last question on the survey has to be the most offensive”
There are no offensive survey questions. Yes, it’s current_year.
Either you think knowing the answer is valuable, or you don’t. And even you admit that the information is useful.
Instead of being all holier-than-them, did you ever stop to notice that these groups are generally listed in order of how religious they tend to be? Most Christians in this country can’t even tell you anything bout the Bible, anything about the calendar except Christmas and Easter, or … anything! But as you go down the list, you find people are more and more invested in their religion. And I sure don’t want that crap in my family.
Now, here’s something about marriage you may not understand if you aren’t marriage. You don’t just marry an individual. You become part of another family. This is what the term “in-law” means. (Seriously, do I even have to explain this?) And if I have to deal with my in-laws, they also have to deal with me. So, YES, just as a potential spouse might say “no way am I marrying into that nuthouse”, it is equally valid for a parent to say “if you marry that nut, count me out”.
Oh, look, your sarcasm broke! 😀